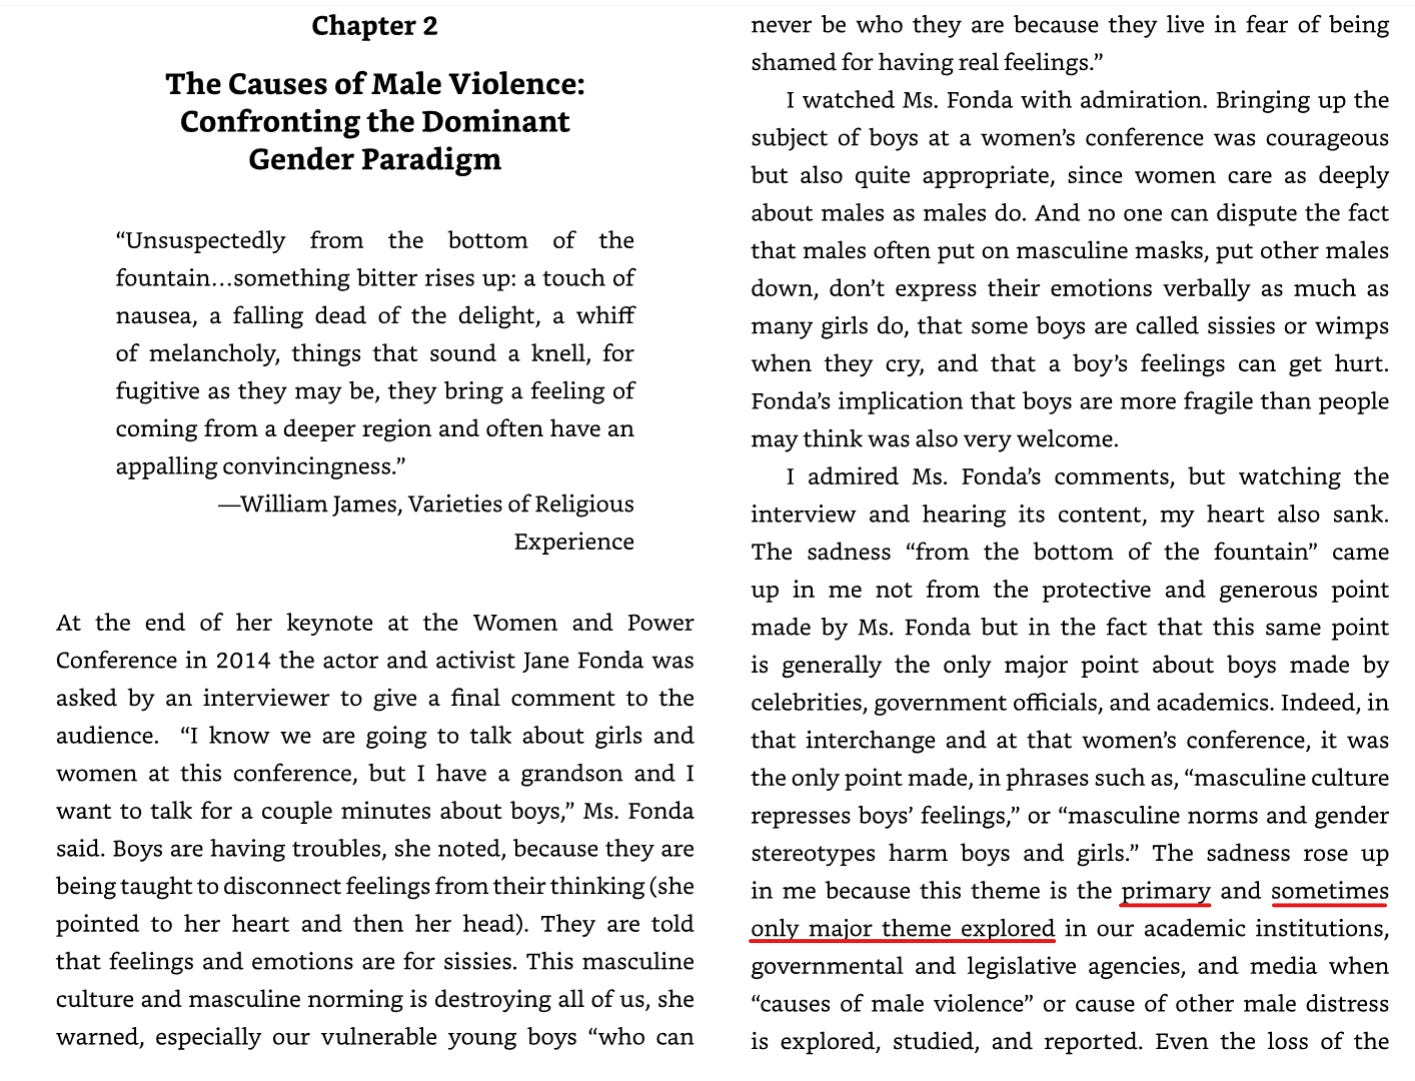
I’d like to take a minute, before I begin to state my intention, and position. I’m a feminist, I’m for equality, I’m for safety, freedom and opportunity for everyone regardless of gender. What I present here, should shock you. It shocked me when I first discovered it four years ago, and it shocked me again to check the stats myself this last week. When I set out to write this article, it was much longer than it is now. However, as I dug more into the stats I realised the statistics themselves would take readers time to digest and process before they were ready to think about implications and discussion and forward action. As such I’ve chosen to split the article in two, here the introduction and numbers, in the second part: the discussions.
It was some time in 2015 I began my training to become a teacher. As it concluded I settled into my first role as a teacher at an outstanding all boys state comprehensive. I was determined to do my best, and I believe strongly in “understanding the problem” before attempting to solve it.
At first, I remember being stunned by some of the poor behaviour of students. In lower sets I was experiencing a “race to the bottom” attitude from entire classes, where it was only important to be funny, never to be smart. These were students with great opportunities (as I saw it then), students in an outstanding school, with teachers who wanted the best from them. So why wouldn’t they engage?
Part of this journey of learning to teach, is a frontline learning experience about the challenges faced by the myriad different walks of life children come from, and so I began reading. I read the fantastic “Boys don’t try: Rethinking Masculinity in Schools” by Matt Pinkett, an in depth look at the exact type of student I was struggling with. It was written with a very practical perspective giving advice on many different techniques, and on the real experiences of such children. I learned why some of the most intuitive decisions are entirely wrong, and why age-old wisdom like “Boys love competition” is the exact kind of thinking that disengages such young men. I can’t recommend the book highly enough to those of you teaching, or even raising young men. It helped me, immensely.
As I became more experienced in the job, I began to notice something that was so obviously wrong that I dismissed it automatically. Young women that I taught (in the sixth form) seemed to be, more resilient, more capable, more confident, more receptive to criticism, and frankly in bigger numbers at higher calibre! That can’t be right, I thought. Women are behind men, societally speaking, right? They’re disadvantaged, they’re underpaid, safety features in cars cause more female deaths than male because they’re designed for men, right? A thousand other reasons, do read Invisible Women, if you haven’t it is a fascinating look at this stuff from a data perspective.
Note: some of these claims are debatable, etc. I’m not here to advocate any of them as fact, they’re just the rhetoric you will likely have heard, and they form a part of overall societal narrative.
Right.
So why was my direct experience contradictory to this? Perhaps it was simple perception bias, or small bubble statistics. Whatever the cause, I couldn’t shake the feeling and so I pursued more information. In early 2017 I stumbled across a book titled “Saving our Sons: A New Path for Raising Healthy and Resilient Boys” by Dr. Michael Gurian. My timing couldn’t have been luckier, the book was only published in January of that same year.
The Dominant Gender Paradigm
Dr. Gurian’s book is all about the struggles of young men right now. This is a challenging topic because of two reasons.
The idea goes against the dominant gender paradigm (DGP).
The statistics aren’t well publicised, nor media friendly. This is mainly due to the first reason.
So, what is the DGP?
The DGP represents the main ideas society holds about the two major genders. I expressed a part of it earlier. You likely hold that same idea. “Women need support to achieve equality in society.” It is not incorrect. In fact, in most of society women still require huge support. They are victims of discrimination, physical and sexual violence, religious oppression, they are underpaid, objectified and so much more. I am not here to convince you otherwise. I just want to add a little nuance, and hopefully gain your support in helping our disaffected young men, its all our fault really.
Here is the crux of the matter, if you take nothing else away from this article please take this: For equality, Women are behind men. But boys are behind girls.
Going against this first thought causes enormous friction in society. I am certainly dreading significant backlash from twitter or otherwise when I post this article, hopefully I’ve laid it out in a way that makes the point unequivocally.
In the past, a number of education professionals, teachers, leaders, support staff and so forth have got in hot water for expressing the idea that boys need more support than girls. Dr. Gurian yells it from the rooftops, and backs it up with statistics.
The subtlest point he makes is one I repeat over and over. Here is the except that stays with me.
Boys currently face many more challenges than girls, and not only do they face them, they generally fare worse at them. In a study on 150,000 disadvantaged households the results showed that boys were impacted more significantly by these situations than girls.
It seems in their latent state boys are more fragile than girls.
Dr. Gurian points out that these stats are not widely known, and they are not well accepted. They go against the dominant thinking regarding gender, and they challenge institutions, parents, and any carer involved with children to adapt their mechanisms to help young men more effectively.
He spends multiple pages in a row simply listing statistics so that the reader can have them easily to hand, quotable and ready to discuss with anyone who disagrees. He calls this the first step to change “Seeing our Sons.” Here is an example of that section:
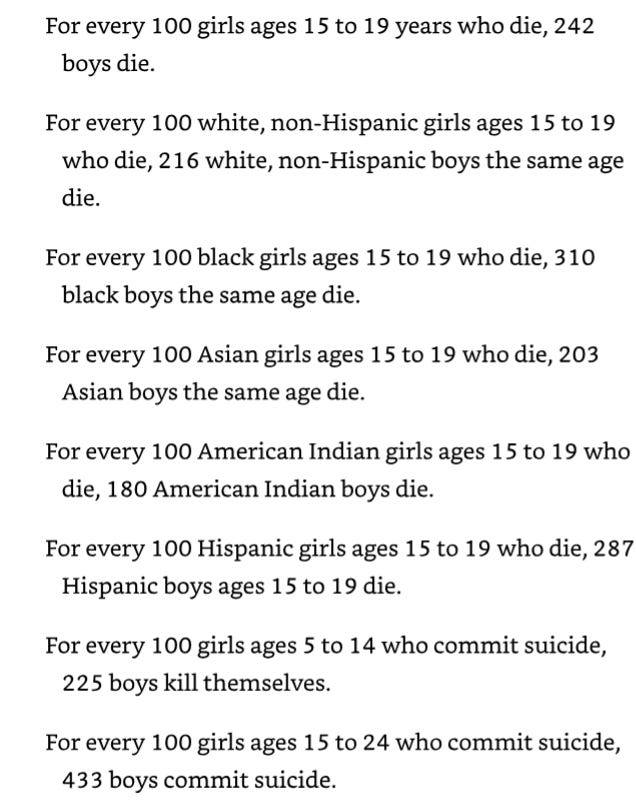
American statistics on death rates for boys and girls, 2017.
This is a fundamental step to “getting the word out” and it is the only real problem I have with the book. It is based on American statistics, American research.
I would hold that America and the United Kingdom are broadly similar in culture, however for some this is a flagrant disrespect to both, and indeed how money is spent by governments is completely different. I have intended for a long time to “do the stats” myself for the UK. I can’t repeat the stats one-to-one as some are simply not applicable to the UK, for example “children who repeat kindergarten”. We do not repeat grades in the United Kingdom.
Anyway, that’s the preamble and context. I was going to go through and discuss the additional issues such as toxic male influencers, lack of opportunity, etc, but when I was going through the statistics I began to recognise the sheer time and mental work it takes to read and digest them, to consider their implications. As such, I will continue the article and the links I see in it later. For now, I’ll just list the stats and let them speak for themselves.
What the stats show us for young men and boys
Taking inspiration from Dr. Gurian’s book, I’m going to present the statistics wherever possible in the form:
For every 100 girls ___, X boys ___.
I like this representation for when there are 2 decimal places involved in the numbers. I know personally I can imagine the difference of 100:127 much better than 1:1.27. For any of the stats if you want a 1:X ratio, it’s easy for you to just divide by 100 the number of boys.
When I first read his book, the chapter where he does this left me reeling. It shattered my expectations exactly as it was supposed to do. I find that one hundred is a very relatable number, and that in this context most people can see the problems more clearly.
I’ve tried to find the same statistics that he did however, I’ve had to change a few, partly because information on them isn’t readily available, such as children reporting seeing drugs in school. And partly because we have certain UK data available that would never be reported in American statistics, such as A-level grades, etc.
All these statistics are based on the publicly available data, from these main 3 primary sources. The analysis is my own in most cases.
Publicly available UK government data for the 2021/2022 academic year, found here.
Young people's substance misuse treatment statistics 2021 to 2022: report. Here.
Education, children’s social care and offending: local authority level dashboard 2019/2020. Here. Better source located during research and writing, see [7].
NHS Data. Smoking, Drinking and Drug Use among Young People in England, 2021: Data tables. Here.
Throughout the stats you will find interspersed thoughts of my own, or informative definitions captured inside quote blocks like this.
Imagine a nice useful definition here, delightful.
Brace yourself, consider each stat, take a break if you need to as some of them are quite heavy, I’ll discuss further the implications and thoughts in part 2 of this article series. Let’s begin.
1. Suspensions and Exclusions
Primary
For every 100 girls suspended from primary education, 570 boys are suspended from primary education. [1]
For every 100 girls permanently excluded from primary education, 752 boys are permanently excluded from primary education. [1]
Quick note about the primary stats: Numbers of exclusions are very low in general here so the stats can be misleading. The exclusion rate for boys is 0.283%, for girls it is 0.038%.
Secondary
For every 100 girls suspended from secondary education, 187 boys are suspended from secondary education. [1]
For every 100 girls permanently excluded from secondary education, 275 boys are permanently excluded from secondary education. [1]
2. SEN - Including physical disability
Stats for those without an Education and Healthcare Plan (EHCP)
For every 100 girls with Speech, Language and Communications needs, 224 boys have Speech, Language and Communications needs. [1]
For every 100 girls identified with a Specific Learning Difficulty, 127 boys are identified with a Specific Learning Difficulty. [1]
For every 100 girls identified with Severe Learning Difficulty, 193 boys are identified with Severe Learning Difficulty. [1]
For every 100 girls with Moderate Learning Difficulty, 141 boys are identified with Moderate Learning Difficulty. [1]
For every 100 girls identified with Autistic Spectrum Disorder, 303 boys are identified with Autistic Spectrum Disorder. [1]
For every 100 girls identified with Profound & Multiple Learning Difficulties, 135 boys are identified with Profound & Multiple Learning Difficulties. [1]
For every 100 girls identified with a Physical Disability, 131 boys are identified with a Physical Disability. [1]
For every 100 girls identified with Social, Emotional and Mental Health, 217 boys are identified Social, Emotional and Mental Health. [1]
For every 100 girls identified with SEN support but no specialist assessment of type of need, 149 have SEN support but no specialist assessment of type of need. [1]
Stats for those with an EHCP
For every 100 girls with Speech, Language and Communications needs, 270 boys have Speech, Language and Communications needs. [1]
For every 100 girls diagnosed with a Specific Learning Difficulty, 194 boys are diagnosed with a Specific Learning Difficulty. [1]
For every 100 girls diagnosed with Severe Learning Difficulty, 196 boys are diagnosed with with Severe Learning Difficulty. [1]
For every 100 girls diagnosed with Moderate Learning Difficulty, 175 boys are diagnosed with Moderate Learning Difficulty. [1]
For every 100 girls with Autistic Spectrum Disorder, 378 boys have Autistic Spectrum Disorder. [1]
For every 100 girls with Profound & Multiple Learning Difficulties, 133 boys have Profound & Multiple Learning Difficulties. [1]
For every 100 girls with a Physical Disability, 138 boys have a Physical Disability. [1]
For every 100 girls diagnosed with a Social, Emotional or Mental Health need, 388 boys are diagnosed with a Social, Emotional or Mental Health need. [1]
3. Drugs
(I’ve left out alcohol as the results are broadly similar for both genders)
For every 100 girls under 18 receiving treatment for substance abuse, 170 boys under 18 are receiving treatment for substance abuse. [2]
E-cigarettes
For every 100 girls who said they had never tried e-cigarettes, 117 boys said the same. [8]
For every 100 girls who said they are currently an e-cigarette used, 51 boys said the same. [8]
Overall
For every 100 girls who had ever taken any drugs, 89 boys said the same. [8]
For every 100 girls who had tried any stimulants, 88 boys had tried the same. [8]
For every 100 girls who had tried any psychedelics, 102 boys had tried the same. [8]
For every 100 girls who had tried any psychoactive substances, 89 boys had tried the same. [8]
For every 100 girls who had tried any opiates, 160 boys had tried the same. [8]
For every 100 girls who had tried any class A drug, 101 boys had tried the same. [8]
Specific drugs
For every 100 girls who had ever taken Cannabis, 103 boys had taken cannabis. [8]
Stimulants
For every 100 girls who had tried Cocaine, 94 boys had tried the same. [8]
For every 100 girls who had tried Ecstasy, 77 boys had tried the same. [8]
For every 100 girls who had tried Mephedrone (a synthetic stimulant), 403 boys had tried the same. [8]
For every 100 girls who had tried Poppers, 169 boys had tried the same. [8]
For every 100 girls who had tried Amphetamines, 116 boys had tried the same. [8]
Psychedelics
For every 100 girls who had tried LSD, 123 boys had tried the same. [8]
For every 100 girls who had tried Magic mushrooms, 98 boys had tried the same. [8]
For every 100 girls who had tried Ketamine, 101 boys had tried the same. [8]
Psychoactive Substances
For every 100 girls who had tried new psychoactive substances (previously known as legal highs), 69 boys had tried the same. [8]
For every 100 girls who had tried Nitrous oxide, 116 boys had tried the same. [8]
Opiates
For every 100 girls who had tried Methadone, 209 boys had tried the same. [8]
For every 100 girls who had tried Heroin, 167 boys had tried the same. [8]
Frequency of drug taking
For every 100 girls who said they had taken drugs one occasion, 66 boys said the same. [8]
For every 100 girls who said they had taken drugs on 2-5 occasions, 70 boys said the same. [8]
For every 100 girls who said they had taken drugs on 6-10 occasions, 40 boys said the same. [8]
For every 100 girls who said they had taken drugs on more than 10 occasions, 137 boys said the same. [8]
For every 100 girls who said their frequency of drug taking was “takes drugs at least once a month”, 114 boys said the same. [8]
For every 100 girls ever offered any drug, 102 boys were ever offered any drug. [8]
For every 100 girls aged 15 who had been offered drugs and took them, 93 boys were aged 15 who had been offered drugs and took them. [8]
I am struck by the following observations:
Boys take opiates (of all kinds) much more often than girls.
Girls take “party” drugs more often, Ecstasy, New psychoactive substances, Cocaine.
Girls smoke e-cigarettes much more commonly.
Double the number of boys take drugs on 10 or more occasions, compared to girls.
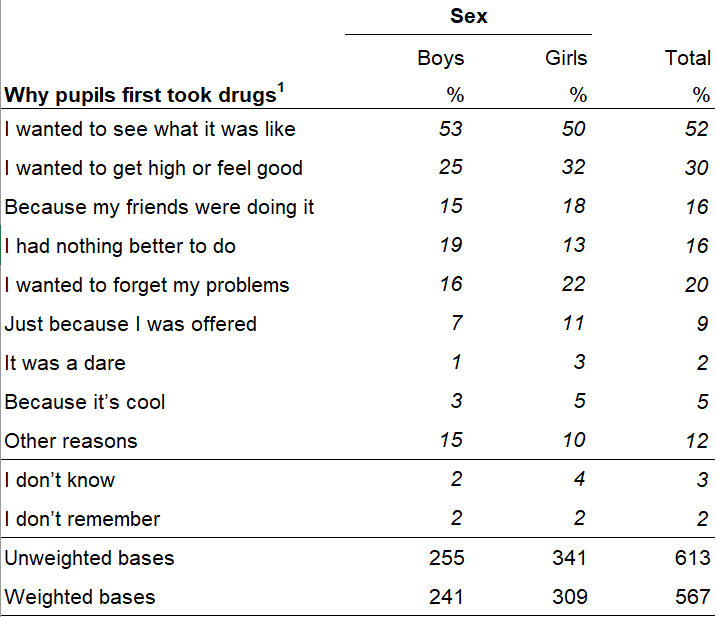
A final, interesting table on the reasons children said they took drugs:
For every 100 girls receiving mental health treatment, 100 boys receive mental health treatment. [2]
For every 100 girls for whom mental health treatment was requested but either did not recieve it or refused it, 130 boys request treatment but either did not recieve it, or refused it. [2]
For every 100 girls receiving treatment for child sexual abuse, 25 boys are receiving treatment for child sexual abuse. [2]
For every 100 girls aged 10-24 who die by suicide, 231 boys aged 10-24 die by suicide. [4]
For every 100 girls aged 5-15 diagnosed with a Mental Health Disorder, 140 boys are diagnosed with a Mental Health Disorder. [4]
6. Education Achievements
GCSE & School Start
For every 100 girls who enter school, 101 boys enter school. [1]
For every 100 girls entering English and Mathematics GCSEs, 100 boys enter English and Mathematics GCSEs. [1]
For every 100 girls achieving grades 5 or above in English and Mathematics, 92 boys achieve grades 5 or above in English and Mathematics. [1]
For every 100 girls making 0.15 grades of progress between age 11 and 16, 100 boys make -0.21 grades of progress between age 11 and 16. [1]
A-level
For every 100 girls achieving 3 A* to A grades at A-level, 100 boys achieve 3 A* to A grades at A-level. [1]
For every 100 girls who achieve 2 or more A levels, 99 boys achieve 2 or more A-levels. [1]
For every 100 girls achieving AAB or better, 94 boys achieve AAB or better. [1]
For every 100 girls who enter study of an A-level subject, 82 boys enter study of an A-level subject. [1]
Higher Education - First Degree Earned (Not first class, just first)
For every 100 young women who enrol to study their first degree, 75 young men enrol to study their first degree. [6]
For every 100 young women who earn their first degree, 70 young men earn their first degree. [6]
For every 100 young women who earn a first-class degree, 66 young men earn a first-class degree. [6]
For every 100 young women who earn a second-class with honours degree, 69 young men earn a second-class with honours degree. [6]
For every 100 young women who earn a second-class degree, 80 young men earn a second-class degree. [6]
For every 100 young women who earn a third-class degree, 85 young men earn a third-class degree. [6]
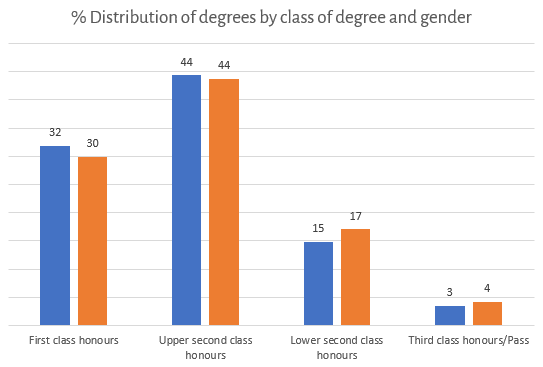
Take note. Be careful how you read those last 4 regarding degree classification. Most students earn first class or second class with honours degrees. It is simply that less men do this that women. Not only do significantly fewer young men earn degrees (145,925 men per 208,180 women). Of those degrees earned, men typically do worse in them. With more earning second and third-class degrees compared to their female counterparts. I’ve included a little bar chart here to help illustrate this.
Chart showing 32% of women earn first class degrees compared with 30% of men. While 17% of men earn second class degrees compared with 15% of women.
This is contrary to expectations, Iwould expect with a larger cohort womens’ results would trend more towards a normal distribution, where the middle achievement is more dominant that the upper achievement.
7. Criminality
If not stated otherwise statistics refer to the year ending March 2022.
For every 100 girls who are cautioned by the police, 639 boys are cautioned by the police. [7]
Note, this is up from 579 in 2019. More boys (compared to girls) are being cautioned than ever before.
For every 100 girls who are First Time Entrants to the criminal justice system in the UK, 567 boys are FTEs to the criminal justice system. [7]
Note, the statistical report even says the following, as if “it’s always been that way” is a justification of some kind:
Misguided statement at best, mislead at worst Mr. (Mrs?) Statistician.
In fact, this annoyed me so much that I went and dug through the previous stats to see just how true it is, I happened to choose cautions issued as the stat to investigate. To my horror it is gettingworse for boys over time. This makes a statement like “it’s always been this way” exceptionally misleading, as while boys have always offended more, proportionally it is getting worse and so it has not “always been this way.” Here is a graph representing the proportion of cautions for three years, 2011-12, 2015-16 and 2021-22.
Chart data compiled from the sources listed under [7]. Showing the % distributionof cautions issued male-to-female.
You can see that in 2012 approximately 25% of all cautions issued were issued to females, in 2015 this number was 17%, and now in 2021 it is 15%. Boys are offending more than girls.
Note that youth offenses have come down something around 90% since 2001, its just this reduction has been proportionally more for girls than boys. In raw numbers, many less boys are offending simply because most offenders are boys.
Continuing…
For every 100 girls who have an offense proven against them, 614 boys have an offense proven against them. [7]
For every 100 girls who have an offense of gravity score 1-4 proven against them, 88 boys have an offense of gravity score 1-4 proven against them. [7]
For every 100 girls who have an offense of gravity score 5-8 proven against them, 283 boys have an offense of gravity score 5-8 proven against them. [7]
Gravity score: An offence’s gravity score is scored out of eight, ranging from one (less serious) up to eight (most serious). For example, non-payment of travel fare has a gravity score of 1 while murder has a gravity score of 8.
Important Disclaimer here: The population of girls in youth custody is extremely low, just 16, and so the stats can be shifted very heavily by individuals and are much less reliable. Still, those 16 girls, appear to be exceptionally challenging to manage. There are 500 boys in youth custody.
For every 100 girls in youth custody, 3233 boys are in youth custody. [7]
For every 100 girls who self-harm while in youth custody, 7 boys harm while in youth custody. [7]
For every 100 girls, there was an average of 1000 assailant or fighter involvements yearly while in youth custody. [7]
For every 100 boys, there was an average of 620 assailant or fighter involvements yearly while in youth custody. [7]
Now this is fascinating. In layman’s terms for every 100 girls in youth custody, there will be 1000 fighters or assailants involved in assault incidents throughout the year. This indicates serious group violence, as the average number of yearly assaults is 400 per hundred children. This means on average 2.5 girls are involved in each incident as assailants or fighters.
Contrasting this, boys show 620 assailants per 400 incidents. Indicating 1.5 fighters per assault. Seems odd to not have 2 combatants in your average assault, but perhaps it is because, if you attack a guard they do not count as part of the per 100 children headcount. As a result more violence against guards will drive the number assailant-to-incident ratio down.
Does this represent that we over select only the very most violent offending girls to go into youth prison? That the distribution of girls in the youth justice system is heavily skewed toward the extreme end compared with boys, or that we over imprison boys resulting in a larger “shouldn’t be there” part of the population.
For every 100 girls in youth custody, there are 2,900 separation incidents per year. [7]
For every 100 boys in youth custody, there are 1,400 separations incidents per year. [7]
A separation incident is similar to solitary confinement or isolation. It is defined as confining the young person to a cell, without any other person present. It can be maintained for up to 22 hours a day, legally.
For every 100 girls in youth custody, there are 410 average monthly use of force incidents. [7]
For every 100 boys in youth custody, there are 80 average monthly use of force incidents. [7]
For every 100 girls in youth custody, there are 2900 average yearly uses of Restrictive Physical Interventions. [7]
For every 100 boys in youth custody, there are 700 average yearly uses of Restrictive Physical Interventions. [7]
For every 100 girls who enter the reoffending cohort, 614 boys enter the reoffending cohort. [7]
In 2011, this would read:
For every 100 girls who reoffend after leaving youth custody, 355 boys reoffend after leaving youth custody.
Please note that: Reoffending rates are the lowest they have ever been, however there has been a drastic reduction in girls reoffending compared with boys. Compared to girls boys reoffend 70% more now than in 2011.
For every 100 girls who reoffend, 150 boys reoffend. (This is subtly different from “entering the reoffending cohort”). [7]
8. Children in Need
For every 100 girls in need, classification N0 - Not stated, 117 boys are classed as in need for the same reason. [1]
For every 100 girls in need, classification N1 - Abuse or neglect, 105 boys are classed as in need for the same reason. [1]
For every 100 girls in need, classification N2 - Child's disability or illness, 196 boys are classed as in need for the same reason. [1]
For every 100 girls in need, classification N3 - Parent's disability or illness, 108 boys are classed as in need for the same reason. [1]
For every 100 girls in need, classification N4 - Family in acute stress, 113 boys are classed as in need for the same reason. [1]
For every 100 girls in need, classification N5 - Family dysfunction, 110 boys are classed as in need for the same reason. [1]
For every 100 girls in need, classification N6 - Socially unacceptable behaviour, 201 boys are classed as in need for the same reason. [1]
For every 100 girls in need, classification N7 - Low income, 122 boys are classed as in need for the same reason. [1]
For every 100 girls in need, classification N8 - Absent parenting, 570 boys are classed as in need for the same reason. [1]
For every 100 girls in need, classification N9 - Cases other than children In need, 128 boys are classed as in need for the same reason. [1]
After all that, I hope I don’t catch you repeating the old classic “the trouble with boys is they can’t express their emotions”. The troubles with boys are numerous, and they need our support.
In Conclusion
I’m sorry if I missed a particular stat you wanted to read. I only have so many hours I can put into this research. There are, I’m sure, many more statistics of interest I could look for. I made the conscious choice to stick to primary, reputable, government statistics wherever I could, and did most of the analysis with excel and elbow grease.
These stats may seem quite depressing, I certainly think so, but we can’t pretend they aren’t there. Boys are behind and falling further behind every year. Perhaps it is a result of the DGP that our young women are doing better than ever before, perhaps they have had the spotlight and received all the proper support, this isn’t a bad thing. However, I would argue it is high time we apply that support more tactfully, and bring our boys back onto course.
For now, I ask you, show the young men of today compassion, talk to them, believe in them and support them. Don’t neglect our young women, but have compassion for this generation of boys, don’t try to tell them they have it easy, don’t apply gender-guilt to a population of boys who have never had it worse. If you do, not only are you plain wrong, but you’ll simply drive them to whoever will believe in them, whoever will give them a way to fight back.
Is it really a wonder toxic male influencers are on the rise?
As always, thanks for reading. Let me know what you think below.
All the data is compiled here. I never planned to share it originally so my apologies for the ugly formatting. You’re better off with the links to the primary data above.
If you found this article interesting, please consider subscribing for more.
And if you think others should be reading this, please do share.